How to Use Databands
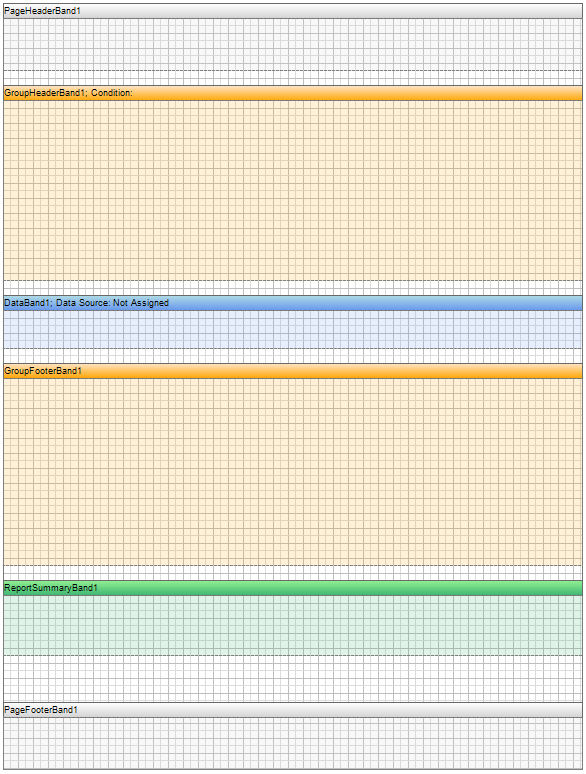
When you open up a format, the first thing you are bound to notice are the bands. Bands are those long rectangular boxes that hold your items in place on the template. Each band type has different properties illustrated by its color. The most common colors are going to be grey, orange, blue and green.

Grey: These bands are always either the PageHeaderBand or the PageFooterBand. The grey bands print at the top or the bottom of the page, and are used to display static content. This is where you will want to put in your company information like your name, address and phone number, as well as your logo. You will not want to put any data that will change per customer, job or invoice in the grey band if you intend to print more than one at a time.
Orange: These bands are always either the GroupHeaderBand or the GroupFooterBand, and you will never really want to delete them. These are the bands needed to “sandwich” your DataBand, with the GroupHeaderBand on top of the blue databand, and the GroupFooterBand underneath it. This is where you’re going to put your customer, job, or invoice data.
Blue: These bands are always the DataBand, and you will never want to delete them. This band should always be “sandwiched” between two orange bands, a GroupHeaderBand and a GroupFooterBand, and will contain your service information. This is where your service name and number, qty and price will print from. You will only ever want to put in information that you want to print for every service; so service pictures will be in the blue band, but you wouldn’t want to put in your CAD map.
Green: These bands are always either the ReportTitleBand (though this option is very rarely used, and appears at the top of the proposal above the orange bands) or the PageSummaryBand (which appears at the bottom of the proposal below the orange bands), and are used to summarize the reports data. They are primarily used for data reports, and will not often come up, though you are free to use them. They are a good way to add in your terms and conditions for a single print form, but will only ever print once per report (making them completely useless for batching).
Adding Bands
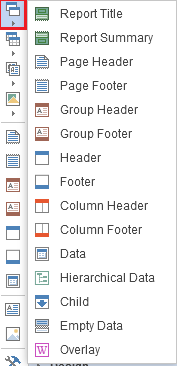
If you ever need to add a band, you will want to do so by going to the left hand side of the report designer, to the second icon going down (this will look like two blue bands overlapping), called Bands. When you click on the Bands option, it will bring up a list of available bands for you to choose from. You will want to limit yourself to the Report Summary, the Page Header and Footer, the Group Header and Footer, and the Data option. When you choose the band option you want, you will want to go to the white space area of your choice and click and drag a box into it.

Note: Some bands have mandatory locations that it will jump to no matter where you try to place it. This is the case with page header and footer bands, which will print only at the top or bottom of the page.
Deleting Bands
You can delete a band by clicking on it once, just so that the small, white boxes appear on the corners, and clicking the delete button on your keyboard. You can also do it by right clicking on the item, and choosing the “Cut” option from the drop down that will appear. You will want to be careful when you do this however, as deleting an orange or blue band can break you template, or, if you delete a band with items inside of it, it can cause errors in your report that will stop it from printing properly. In circumstances like this, it is best to delete the items first.
Authored by Betsy Rainey on 05/16/2023